Promtail Deprecation: What’s Next for Log Collection in Grafana?

- Written by:
- Meet Gori
- Kubernetes, Observability
- No Comments
With the deprecation of Promtail, teams using it to collect and push logs to Loki now need to plan their migration path. Promtail’s core functionality is being replaced by Grafana Alloy, a unified and modular observability agent that brings together logs, metrics and traces under one framework. While Promtail has been a cornerstone of Loki-based logging pipelines, the shift toward Alloy reflects the growing need for end-to-end telemetry in modern cloud environments. In this post, we’ll explore why Promtail is being phased out, what Alloy offers as its successor.
What is Alloy?
Alloy is an open-source telemetry pipeline tool built by Grafana Labs. Where Promtail was primarily focused on forwarding logs into Loki, Alloy is designed with a bigger mission in mind. It provides a unified way to collect, transform, and route different kinds of telemetry signals including logs, metrics, traces and events.
At its core, Alloy acts as a highly flexible pipeline engine. You define sources of telemetry data, apply transformations, and then send that data to destinations. Instead of being limited to logs, Alloy works across all three pillars of observability. That makes it a natural fit for organizations adopting OpenTelemetry, since it can act as both a collector and processor in an observability stack.
Another major advantage of adopting Alloy is consolidation it can replace multiple exporters and agents running on each node. For instance, you no longer need a separate Node Exporter for metrics collection, as Alloy can natively collect system and host-level metrics alongside logs and traces.
Why Is Promtail Being Deprecated?
Promtail has been with us since the early days of Grafana Loki. Its main purpose has always been to collect logs and push them into Loki, where they could be queried and visualized alongside metrics. For many, Promtail was their first taste of what a log aggregation system could look like outside of traditional solutions like Fluentd or Logstash.
However, Promtail was never designed to handle workloads beyond logs. While it excelled at tailing files, scraping logs from Kubernetes pods, attaching labels, and pushing them to Loki, it had limitations. As companies adopted cloud-native and microservice architectures, logging became only one part of a much more complex observability puzzle. Teams started demanding a unified way to manage metrics, logs and traces.
Grafana Labs realized that maintaining Promtail as a standalone project made less sense in the long term. Promtail’s architecture was restrictive, its pipeline capabilities were limited, and it overlapped with what the OpenTelemetry collector was already doing for traces and metrics. Alloy was introduced as a more extensible solution that could replace Promtail while delivering a better experience for modern observability.
Comparing Promtail vs Alloy
| Aspect | Promtail | Alloy |
|---|---|---|
Scope |
Log shipper for Loki |
Telemetry pipeline for logs, metrics, traces |
Architecture |
Tight integration with Loki |
Modular plugin-based pipeline |
Flexibility |
Focused on log collection |
Highly flexible, can route and transform multiple data types |
Processing |
Basic relabeling for logs |
Rich data processing with filters, transformations, batching |
Performance |
Lightweight but limited |
Optimized for high throughput and multi-signal environments |
Ecosystem support |
Loki only |
Works with Loki, Prometheus, Tempo, OTLP exporters, and many more |
Future support |
Will deprecated and maintenance-only |
Active development and expanding ecosystem |
Deploying Grafana Alloy via Helm
Prerequisites: Make sure that a Kubernetes cluster and Helm are already set up and configured. Also, verify that the monitoring namespace exists or create it before deploying Grafana Alloy.
Before moving ahead with Alloy installation, it’s a good to add and update the official Grafana Helm repository to make sure you have access to the latest chart versions
					helm repo add grafana https://grafana.github.io/helm-charts
helm repo update
After updating the repository, the next step is to install Grafana Alloy in the desired namespace (for example, monitoring) using the custom values file.
helm install alloy grafana/alloy -n monitoring -f alloy-values.yml
Example Alloy Configuration for Logs and Traces
The following configuration shows how Alloy can act as a single telemetry pipeline for both logs (from Kubernetes pods) and traces (via OTLP to Tempo). This example successfully collects Kubernetes pod logs, applies relabeling, enriches them with extra labels, and ships them to Loki, while also exposing OTLP receivers for trace ingestion and forwarding them to Tempo.
					alloy:
  configMap:
    create: true
    content: |-
      loki.write "default" {
        endpoint {
          url = "http://loki:3100/loki/api/v1/push"
        }
      }

      discovery.kubernetes "pod" {
        role = "pod"
      }

      discovery.relabel "pod_logs" {
        targets = discovery.kubernetes.pod.targets

        rule {
          source_labels = ["__meta_kubernetes_namespace"]
          action = "replace"
          target_label = "namespace"
        }

        rule {
          source_labels = ["__meta_kubernetes_pod_name"]
          action = "replace"
          target_label = "pod"
        }

        rule {
          source_labels = ["__meta_kubernetes_pod_container_name"]
          action = "replace"
          target_label = "container"
        }

        rule {
          source_labels = ["__meta_kubernetes_pod_label_app_kubernetes_io_name"]
          action = "replace"
          target_label = "app"
        }

        rule {
          source_labels = ["__meta_kubernetes_namespace", "__meta_kubernetes_pod_container_name"]
          action = "replace"
          target_label = "job"
          separator = "/"
          replacement = "$1"
        }

        rule {
          source_labels = ["__meta_kubernetes_pod_uid", "__meta_kubernetes_pod_container_name"]
          action = "replace"
          target_label = "__path__"
          separator = "/"
          replacement = "/var/log/pods/*$1/*.log"
        }

        rule {
          source_labels = ["__meta_kubernetes_pod_container_id"]
          action = "replace"
          target_label = "container_runtime"
          regex = "^(\\S+):\\/\\/.+$"
          replacement = "$1"
        }
      }

      loki.source.kubernetes "pod_logs" {
        targets    = discovery.relabel.pod_logs.output
        forward_to = [loki.process.pod_logs.receiver]
      }

      loki.process "pod_logs" {
        stage.static_labels {
            values = {
              cluster = "kind-cluster",
            }
        }

        forward_to = [loki.write.default.receiver]
      }

      otelcol.receiver.otlp "otlp_receiver" {
        grpc {
          endpoint = "0.0.0.0:4317"
        }

        http {
          endpoint = "0.0.0.0:4318"

          cors {
            allowed_origins = ["*"]
            allowed_headers = ["*"]
            max_age         = 600
          }
        }

        output {
          traces = [otelcol.exporter.otlp.tempo.input]
        }
      }

      // OTLP exporter to Tempo
      otelcol.exporter.otlp "tempo" {
        client {
          endpoint = "tempo:4317"
          tls {
            insecure = true
          }
        }
      }

    name: null
    key: null

  clustering:
    enabled: false
    name: ""
    portName: http

  stabilityLevel: "generally-available"
  storagePath: /tmp/alloy
  listenAddr: 0.0.0.0
  listenPort: 12345
  listenScheme: HTTP
  uiPathPrefix: /
  enableReporting: true
  extraEnv: []
  envFrom: []
  extraArgs: []
  extraPorts: []
  hostAliases: []
  mounts:
    varlog: false
    dockercontainers: false
    extra: []

  securityContext: {}
  resources: {}

  lifecycle: {}
  livenessProbe: {}
  extraPorts:
    - name: otlp-grpc
      port: 4317
      targetPort: 4317
      protocol: TCP
    - name: otlp-http
      port: 4318
      targetPort: 4318
      protocol: TCP
Understanding the Alloy Pipeline Flow
As we can see in the image below the Grafana Alloy pipeline graph view, which visualizes data flow between components in real time. It highlights the complete pipeline from Kubernetes pod discovery and log processing to Loki for log storage, and OTLP trace export to Tempo. One of Alloy’s advantages is its built-in visual dashboard for monitoring and debugging pipelines directly. This dashboard can also be exposed externally through an Ingress, enabling easy access and centralized management of telemetry pipelines within the cluster.
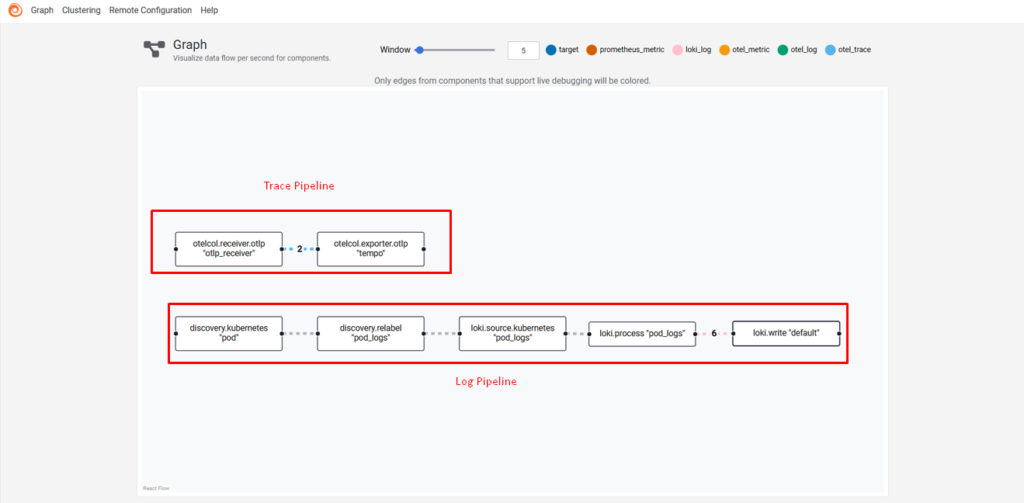
How the Log Pipeline Transfers Kubernetes Logs to Grafana Loki
- discovery.kubernetes discovers pods.
- discovery.relabel attaches meaningful labels (namespace, pod, container, app, job) and points to container log files.
- loki.source.kubernetes reads the container log files.
- loki.process enriches logs with static labels (e.g., cluster name).
- loki.write sends the processed logs to Loki.
How the Trace Pipeline Collects Kubernetes Traces and Delivers Them to Grafana Tempo
- otelcol.receiver.otlp listens on gRPC (4317) and HTTP (4318) for incoming OpenTelemetry traces.
- otelcol.exporter.otlp forwards those traces to Tempo for distributed tracing.
- This setup unifies logs and traces in a single Alloy instance, reducing operational complexity and showing exactly why Alloy is more capable than Promtail.
Final Thoughts