
- Written by:-
- Manav Kakani
- DevSecOps
- No Comments
In modern distributed systems and cloud-native applications, understanding how requests flow through services is critical for maintaining performance, reliability, and debuggability. Traditional logging alone often falls short when it comes to tracking issues across multiple components or services. This is where tracing becomes essential.
Tracing provides end-to-end visibility into the lifecycle of a request as it propagates through various parts of the system.
It helps developers and operators:
- Diagnose performance bottlenecks by showing where time is spent within and across services.
- Understand request flows through complex microservice architectures.
- Identify root causes of errors by correlating traces with logs and metrics.
- Improve system observability by offering a unified view of application behavior.
- Monitor dependencies between internal and third-party services.
What is OpenTelemetry?
OpenTelemetry (often abbreviated as OTel) is an open-source framework designed to collect, process, and export telemetry data such as traces, metrics, and logs. This data provides insights into the performance and behavior of applications.
Developed under the Cloud Native Computing Foundation (CNCF), OpenTelemetry is vendor-neutral, meaning it works with various observability tools and platforms, both open-source and commercial.
Why Use OpenTelemetry?
- Unified Data Collection: Instead of using separate tools for traces, metrics, and logs, OpenTelemetry provides a single set of APIs and libraries to collect all three types of telemetry data.
- Vendor-Agnostic: OpenTelemetry doesn’t lock you into a specific vendor. You can send your telemetry data to various backends like Azure Application Insights, Prometheus, Jaeger, and more.
- Supports Multiple Languages: OpenTelemetry offers SDKs for several programming languages, including Java, .NET, Python, and JavaScript, making it versatile for different application stacks.
🛠️ How Does It Work?
OpenTelemetry is an open-source observability framework that provides a standard way to collect telemetry data—traces, metrics, and logs—from applications. When combined with Azure Application Insights, it allows you to monitor distributed systems, track request flows, and analyze performance bottlenecks in real time.
Here’s a breakdown of how the integration works:
- Instrumentation with OpenTelemetry: The first step is to instrument your application using OpenTelemetry SDKs. This means adding code (or auto-instrumentation agents) that capture spans—which represent units of work like HTTP requests, database queries, or internal method calls.
- Exporting Telemetry Data: OpenTelemetry doesn’t store or visualize traces on its own. Instead, it uses exporters to send the collected telemetry data to a backend like Azure Application Insights.
- Observability Across Services: If your application is composed of multiple services (microservices, APIs, background workers), OpenTelemetry helps correlate spans across boundaries using trace context propagation.
🎯 The Outcome
By using OpenTelemetry and Azure Application Insights together, you get:
- Automatic distributed tracing
- Performance visibility without vendor lock-in
- Real-time diagnostics and alerting
- A modern, scalable approach to monitoring complex applications
⚙️ Setting Up Tracing in Your Application
To facilitate this, we’ll utilize OpenTelemetry, an open-source observability framework that provides standardized APIs and libraries for collecting telemetry data such as traces, metrics, and logs. OpenTelemetry supports multiple programming languages, including Python, and integrates seamlessly with various observability backends, including Azure Application Insights.
OpenTelemetry makes it easy to instrument applications in a variety of languages including Java, .NET, Python, JavaScript, Go, and more. No matter what tech stack you’re using, OpenTelemetry provides a consistent way to capture traces and monitor your services.
 In this guide, we’ll use Python to demonstrate the setup, but the core concepts are the same across other languages.
🧰 What You Need
Before we dive into code, make sure you have:
- Python 3.10+
- Azure Application Insights or any other exporter to export the tracing
- OpenTelemetry Packages:
					opentelemetry-api
opentelemetry-sdk
opentelemetry-instrumentation-flask
opentelemetry-instrumentation-requests
azure-monitor-opentelemetry-exporter
azure-core-tracing-opentelemetry
📡 Integrate the Azure Application Insights to receive the Traces
To visualize and analyze the trace data collected by OpenTelemetry, you need to send it to a backend observability platform. Azure Application Insights is a powerful tool that provides real-time monitoring, distributed tracing, and deep diagnostics. In this section, we’ll configure your application to export traces directly to Azure Application Insights, enabling you to track performance, detect issues, and gain full visibility into your application’s behavior.
Note: You can also choose the different platform to send the traces (e.g Jaeger, Prometheus, ElasticSearch)
					from azure.monitor.opentelemetry import configure_azure_monitor

connection_string = os.environ.get("AZURE_MONITOR_CONNECTION_STRING")

configure_azure_monitor(
    connection_string=connection_string,
    enable_traces=True,
    enable_metrics=True
)
- connection_string: Specifies the Azure Monitor Application Insights resource to which telemetry data will be sent.
- enable_traces: Enables the collection and export of trace data, which includes information about the execution flow of the application.
- enable_metrics: Enables the collection and export of metric data, such as performance counters and custom metrics.
🧪 Tracing with OpenTelemetry in Python
The following example demonstrates how to set up basic tracing using OpenTelemetry in a Python application, specifically with support for Azure SDKs and Azure AI services. This setup helps you trace operations, monitor execution flow, and capture telemetry from Azure service calls.
					import os
from opentelemetry import trace

# Declare OpenTelemetry as enabled tracing plugin for Azure SDKs
from azure.core.settings import settings

settings.tracing_implementation = "opentelemetry"

#(only for the AI application)
# Enable content recording for AI spans
os.environ['AZURE_TRACING_GEN_AI_CONTENT_RECORDING_ENABLED'] = 'true'

#Create a tracer instance
tracer = trace.get_tracer(__name__)

#Create and use a span
with tracer.start_as_current_span("sample-trace-span"):
    print("This is inside a traced span")
Explanation:
- settings.tracing_implementation = “opentelemetry” : This line tells Azure SDKs to use OpenTelemetry for tracing any internal calls. It’s useful when your app uses Azure services like Blob Storage, Key Vault, Open AI, etc.
- os.environ[‘AZURE_TRACING_GEN_AI_CONTENT_RECORDING_ENABLED’] = ‘true’ : Optional setting for Azure AI Services. Allows tracing to capture the prompts, responses, or content from AI calls (useful for debugging or compliance).
- trace.get_tracer(name) : Creates a tracer instance, which is like a tool you’ll use to create spans (traceable blocks of code).
- with tracer.start_as_current_span(“sample-trace-span”) : Creates a new span with the name “sample-trace-span”. Any code inside this block will be recorded as part of the trace. Spans help you understand what happened and when during execution.
🧩 Example: Creating Spans with Dynamic Values
In real-world applications, span names and attributes often depend on runtime context — such as request paths, user IDs, or operation types. OpenTelemetry allows you to create dynamic spans and enrich them with custom attributes, making your traces more meaningful and searchable in observability platforms like Azure Application Insights.
					from opentelemetry import trace

# Create a tracer instance
tracer = trace.get_tracer(__name__)

# Example dynamic values from your app
user_id = "abc123"
order_id = "order789"
status = "processing"

# Create a span and attach dynamic values as attributes
with tracer.start_as_current_span("process-order") as span:
    # Add custom attributes to the span
    span.set_attribute("user.id", user_id)
    span.set_attribute("order.id", order_id)
    span.set_attribute("order.status", status)

    print(f"Processing order {order_id} for user {user_id}")
Explanation:
- start_as_current_span(“process-order”): Creates a span with a custom name.
- span.set_attribute(key, value): Adds key-value pairs (custom metadata) to the span.
- These attributes help you filter and analyze traces in Azure Application Insights (or any backend).
- Example: You could filter all failed orders by order.status = “failed”.
🌲 Implementing Multiple and Nested Spans
In most real-world applications, operations are composed of sub-operations—like an API request that triggers a database query and a third-party API call. To represent this full chain of events in tracing, OpenTelemetry lets you create nested spans, where one span (parent) contains other spans (children).
Creating Multiple Spans
Track sequential operations using separate spans:
					from opentelemetry import trace

tracer = trace.get_tracer(__name__)

def process_order(order_id):
    with tracer.start_as_current_span("inventory-check") as check_span:
        check_span.set_attribute("order.id", order_id)
        # Inventory verification logic
        print(f"Checking inventory for {order_id}")

    with tracer.start_as_current_span("payment-processing") as payment_span:
        payment_span.set_attribute("order.id", order_id)
        # Payment processing logic
        print(f"Processing payment for {order_id}")
Nested Spans for Sub-Operations
Represent parent-child relationships for complex operations:
					def handle_order(request):
    with tracer.start_as_current_span("order-handler") as parent_span:
        parent_span.set_attribute("http.method", request.method)

        # Database operation as child span
        with tracer.start_as_current_span("db-query") as child_span:
            child_span.set_attribute("db.query", "SELECT * FROM inventory")
            # Execute database query
            print("Querying database...")

        # External API call as another child
        with tracer.start_as_current_span("payment-gateway") as child_span:
            child_span.set_attribute("gateway.provider", "Stripe")
            # Process payment
            print("Processing payment...")
In trace visualization tools, this appears as:
					order-handler (parent)
├── db-query (child)
└── payment-gateway (child)
🔍 Tracing AI Workflows with OpenTelemetry and Azure Application Insights
This section shows how you can instrument your AI workflow using OpenTelemetry and send all traces directly to Azure Application Insights.
We’ll simulate an AI interaction using Python where a prompt is processed, sent to a mock LLM (like Azure OpenAI’s gpt-4o), and a response is returned. Each key step is traced using OpenTelemetry, and the data is exported to Azure Monitor using the azure-monitor-opentelemetry integration.
🧪 Sample Python Code with Tracing and Export
					import os
import time
from opentelemetry import trace
from azure.monitor.opentelemetry import configure_azure_monitor

# Setup Azure Monitor export
connection_string = os.environ.get("AZURE_MONITOR_CONNECTION_STRING")
configure_azure_monitor(
    connection_string=connection_string,
    enable_traces=True,
    enable_metrics=True
)

# Initialize tracer
tracer = trace.get_tracer(__name__)

# Simulated user input and AI model info
user_prompt = "Explain quantum computing in simple terms."
model_name = "gpt-4o"
deployment_name = "gpt-4o"
response_text = ""

# Simulated functions
def process_user_prompt(prompt):
    with tracer.start_as_current_span("preprocessing") as span:
        span.set_attribute("input.length", len(prompt))
        time.sleep(0.1)  # simulate processing
        return prompt.strip()

def call_model(prompt):
    with tracer.start_as_current_span("llm_invoke") as span:
        span.set_attribute("model.name", model_name)
        span.set_attribute("deployment.name", deployment_name)
        time.sleep(0.3)  # simulate model call latency
        # Simulated response
        return "Quantum computing is a new way of solving problems using quantum mechanics."

def postprocess_response(response):
    with tracer.start_as_current_span("postprocessing") as span:
        time.sleep(0.1)
        return response + " ⚛️"

# Main tracing block
with tracer.start_as_current_span("azure_openai_invoke") as main_span:
    start_time = time.time()

    # Metadata
    main_span.set_attribute("span_type", "GenAI")
    main_span.set_attribute("gen_ai.system", "azure_openai")
    main_span.set_attribute("gen_ai.operation.name", "completion")
    main_span.set_attribute("function.name", "invoke")
    main_span.set_attribute("function.path", "AzureOpenAIService.invoke")

    # User prompt as event
    main_span.add_event(
        name="gen_ai.user",
        attributes={
            "gen_ai.event.content": {
                "role": "user",
                "content": user_prompt
            }
        }
    )

    # Simulated AI process
    processed_prompt = process_user_prompt(user_prompt)
    raw_response = call_model(processed_prompt)
    response_text = postprocess_response(raw_response)

    # AI assistant response as event
    main_span.add_event(
        name="gen_ai.assistant",
        attributes={
            "gen_ai.event.content": {
                "role": "assistant",
                "content": response_text
            }
        }
    )

    # Latency tracking
    total_latency = int((time.time() - start_time) * 1000)
    main_span.set_attribute("latency_ms", total_latency)
    main_span.set_attribute("response_length", len(response_text))
    main_span.set_attribute("model_used", model_name)

print("✅ Trace completed and sent to Azure Application Insights!")
Note: This is just an Example.
🧠 Explanation of the Code
| Part | Description |
|---|---|
| Azure Monitor Setup | Initializes the OpenTelemetry SDK and configures export to Application Insights using the AZURE_MONITOR_CONNECTION_STRING. |
| Tracer Initialization | Creates a tracer instance used to define spans throughout the process. |
| AI Workflow Functions | Modular functions simulate real-world AI tasks—each wrapped in its own traceable span. |
| Main Span: azure_openai_invoke | This is the root span that encompasses the full request-response cycle, from prompt to output. |
| Trace Events | Records user prompt and assistant response as structured events inside the trace. |
| Custom Attributes | Captures latency, input size, and model metadata for deeper analysis in the trace UI. |
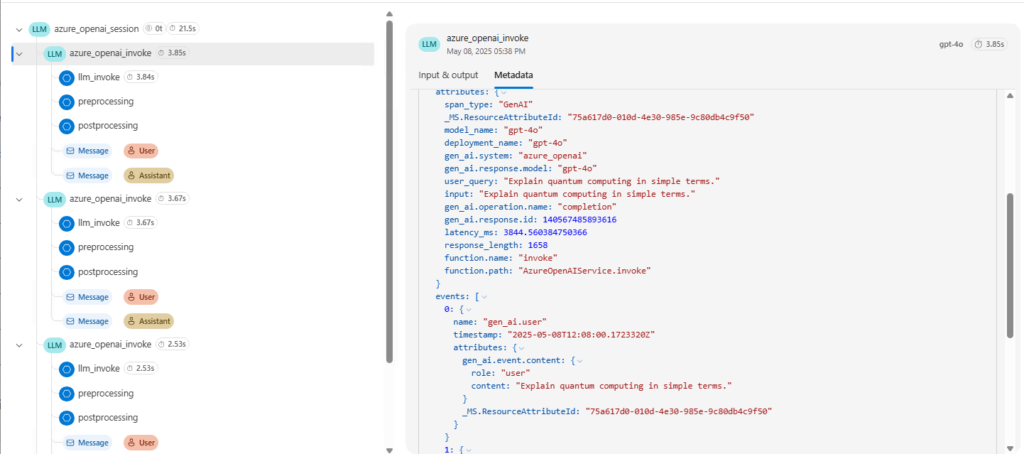
📸 Trace View of an AI Request in Azure Application Insights
Conclusion
By integrating OpenTelemetry with Azure Application Insights, you’ve equipped your application with powerful observability superpowers.
You can now:
 Trace every step of a request, from user input to output.
- Capture latency, application metadata, and structured events like request flows and responses.
- Debug and optimize performance in complex applications.
- Standardize telemetry across distributed systems using an open-source, vendor-neutral approach.
 Trace every step of a request, from user input to output.
 Capture latency, application metadata, and structured events like request flows and responses.
 Debug and optimize performance in complex applications.
 Standardize telemetry across distributed systems using an open-source, vendor-neutral approach.
This setup not only improves transparency and debugging, but also builds a foundation for scalable, production-grade monitoring in AI-driven applications.